Number of microbial species reported to degrade plastics from each country
The circle sizes represent the number of microorganisms with plastic-degrading capabilities that were isolated in each country. All counts relating to microorganisms isolated in a specific country are clustered in a circle located in the center of the country. The two bigger circles represent Japan and India, which have isolated 14.1% and 13.8% of the total number of microorganisms, respectively. Countries with no red circles were found to have no published studies on isolates.
Increase in publications and microbial species reported to degrade plastics over the years
The number of publications found by our search terms that reported plastic-degrading microorganisms per annum and the cumulative number of putative plastic-degrading species identified between 1974 to April 2020. For species already known to degrade plastic, the discovery they could degrade another type of plastic was counted in terms of adding to the number of publications, but did not contribute towards the number of known plastic-degraders.
Environments where potential plastic-degrading microorganisms were isolated
Environments from where microorganisms with plastic degrading capabilities were isolated from. There were 408 scientific publications and 436 species reported to degrade plastic. The category “Others” include microorganisms isolated from cheese, natural salt pans, spacesuits, basidiocarp of mushrooms, aircraft, and animal fodder.
Phylogenetic tree showing the distribution of all microorganisms reported as having potential plastic-degrading capabilities plus non-degrading species
(Click here to zoom) Phylogenetic tree showing the distribution of all microorganisms reported as having plastic-degrading capabilities. The tree was built by combining 436 known plastic degraders identified in the present study (and also shown in Fig. 1) with another 7,000 bacterial and fungal species. The phylogenetic relationship among species was downloaded from the NCBI taxonomy database. Blue bars outside the tree highlight the location of the 436 reported plastic degraders. Leaves are coloured according to corresponding phylum. The five largest phyla on the tree are Proteobacteria (37.1%), Ascomycota (16.9%), Actinobacteria (14.3%), Firmicutes (13.8%), and Basidiomycota (8.1%). A full interactive version of the tree is available at http://itol.embl.de/shared/gambarini with the code P4.
Phylogenetic tree showing all microorganisms identified as having potential plastic-degrading capabilities
(Click here to zoom) Phylogenetic tree showing all microorganisms identified as having potential plastic-degrading capabilities. The phylogenetic relationship among species was downloaded from the NCBI taxonomy database. Leaves are coloured according to their corresponding phyla. Data points plotted outside the tree represent the ability of each individual microorganism to degrade each of the plastics shown in the legend. The legend order from top to bottom is the same as the order of rings external to the tree, from the inside to outside. Bacteria belonging to the family Pseudonocardiaceae and the order Bacillales are identified by thicker branches on the tree. The phylogenetic relationship among the reported degraders was extracted from the NCBI taxonomic database classification system. An interactive version of the tree with all plastic types is available at http://itol.embl.de/shared/gambarini with the code P1. All trees used in this publication are each accessible via this website, from P1 to P5; chronologically updated trees are also available and are termed U1 to U3.
Phylogenetic tree showing all phyla with species reported to potentialy degrade plastics
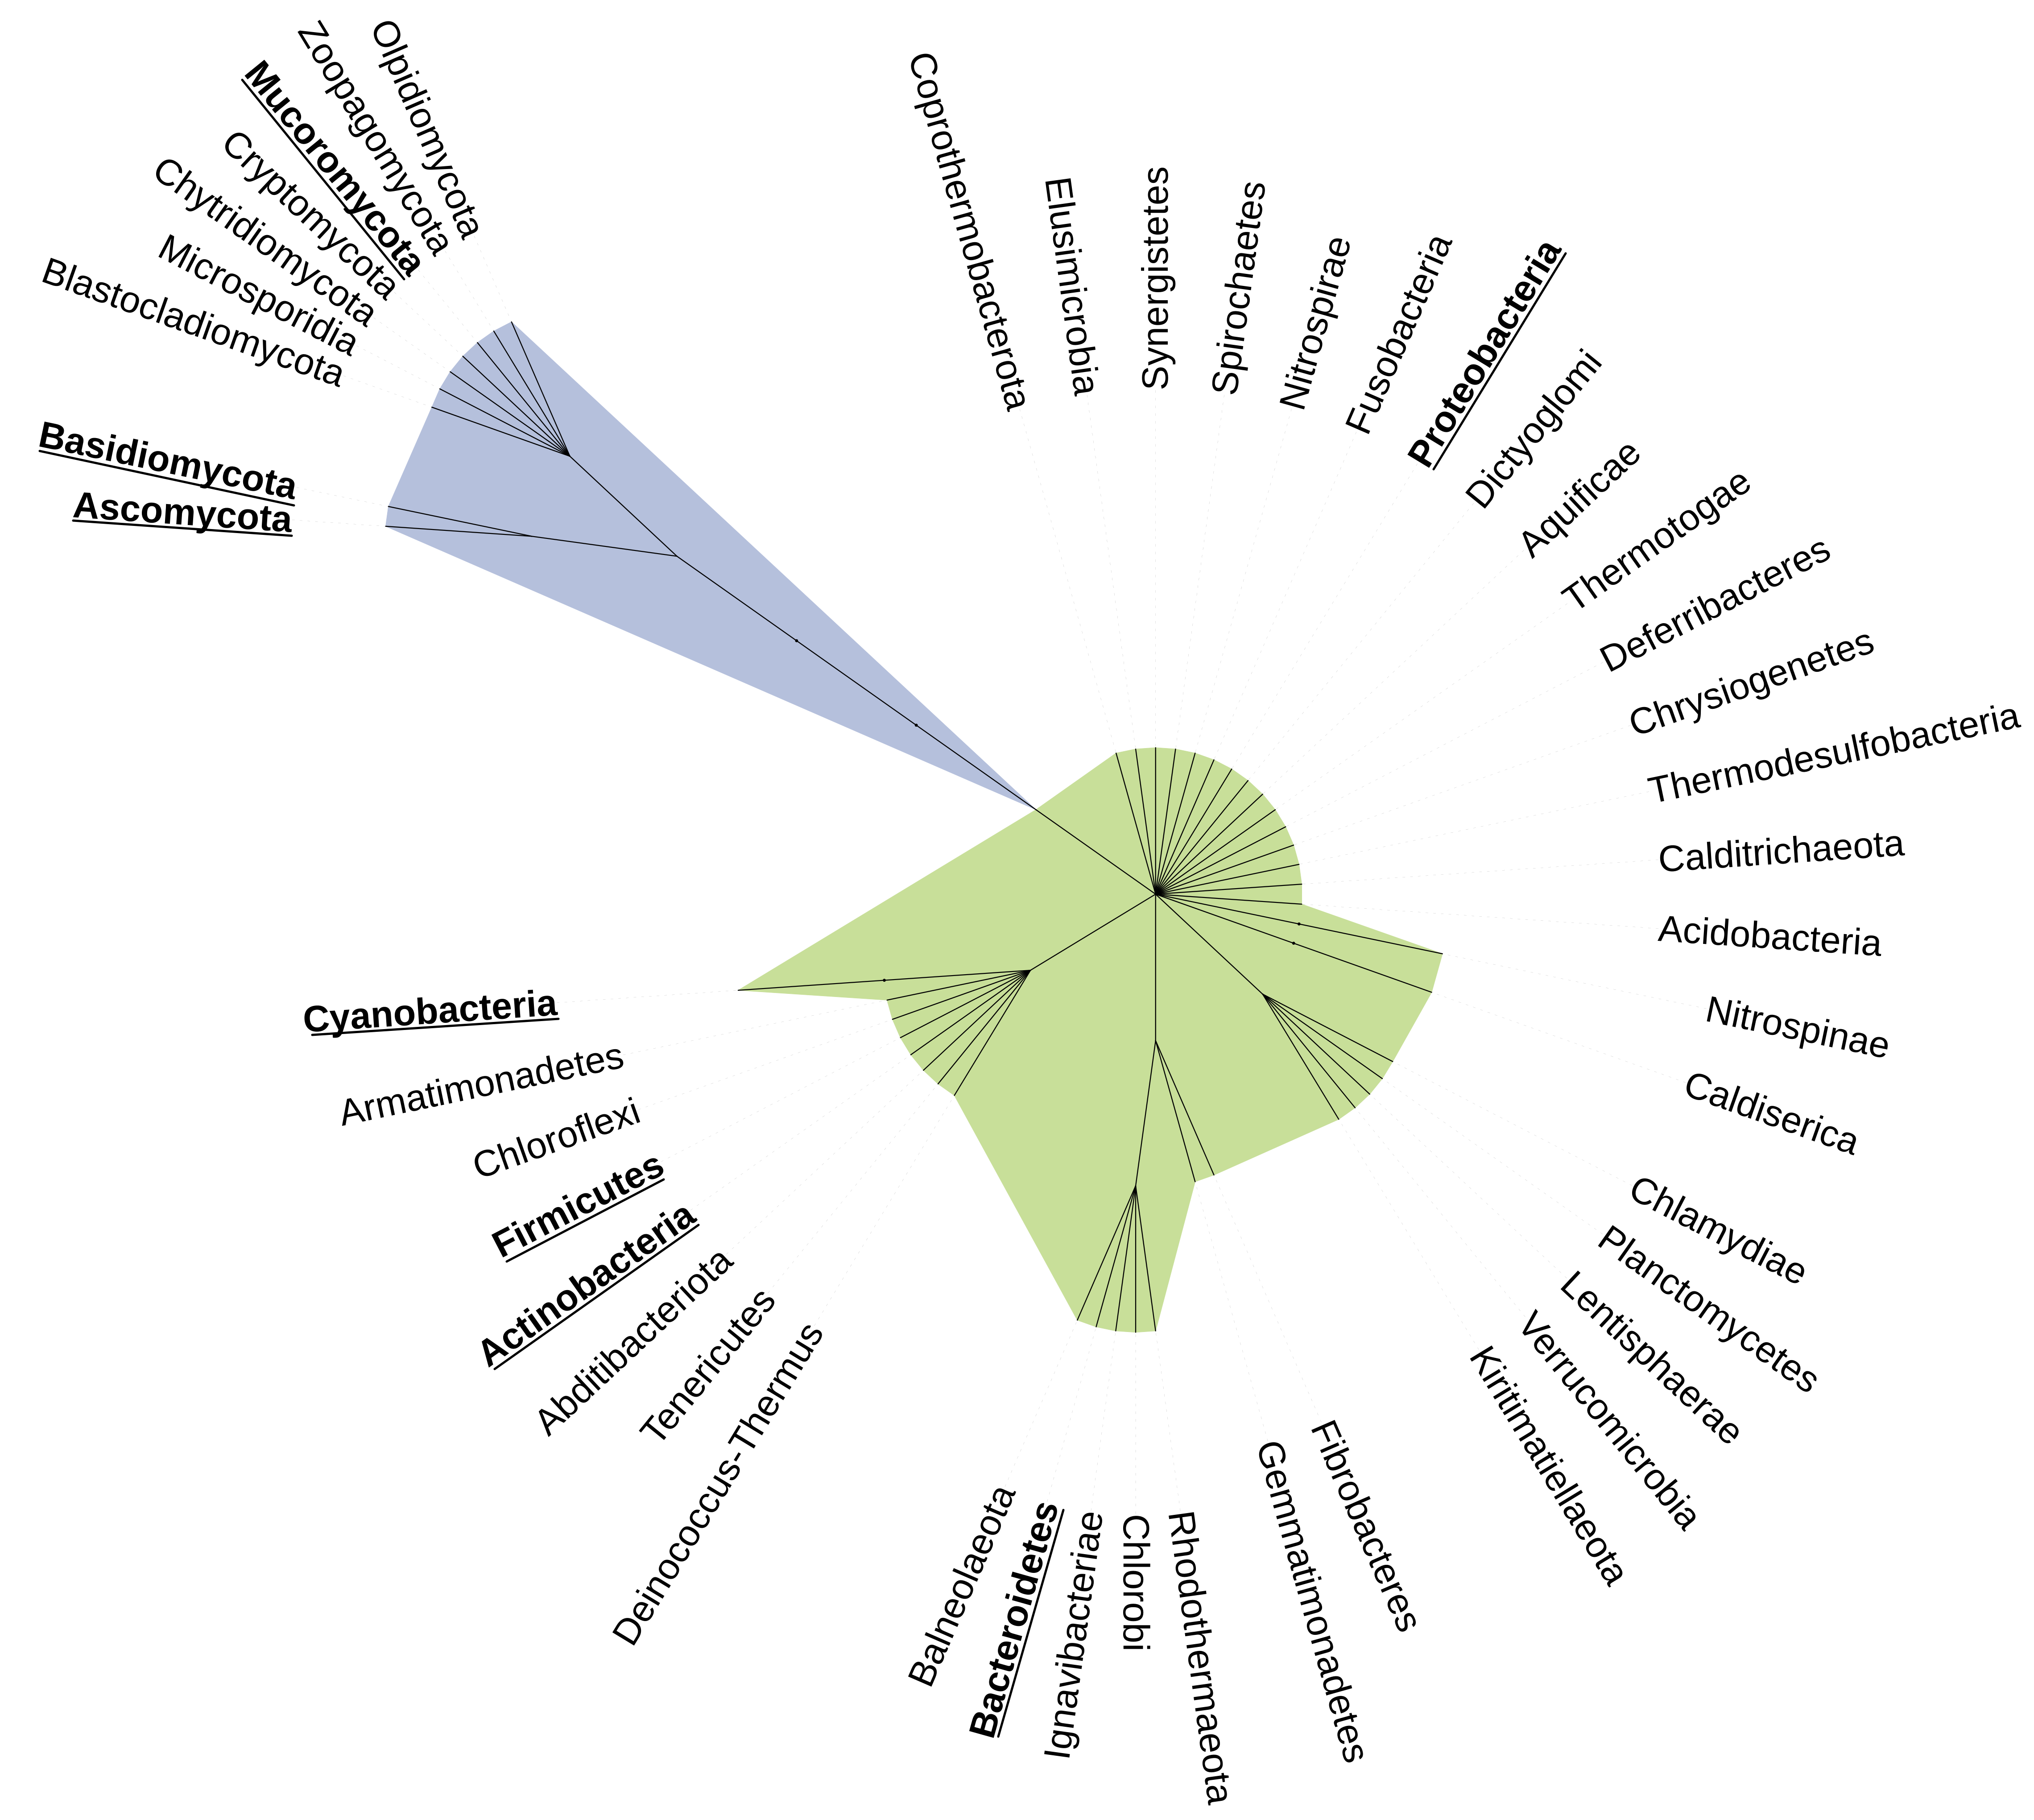
Phylogenetic tree showing phyla reported to degrade plastic. The phylogenetic relationship among phyla was downloaded from the NCBI taxonomy database. Names in bold represent the bacterial and fungal phyla that have species reported to degrade plastics. Bacterial phyla are shown in green, and fungal phyla are in blue.
Relative abundance of all taxa reported to potentialy degrade plastics
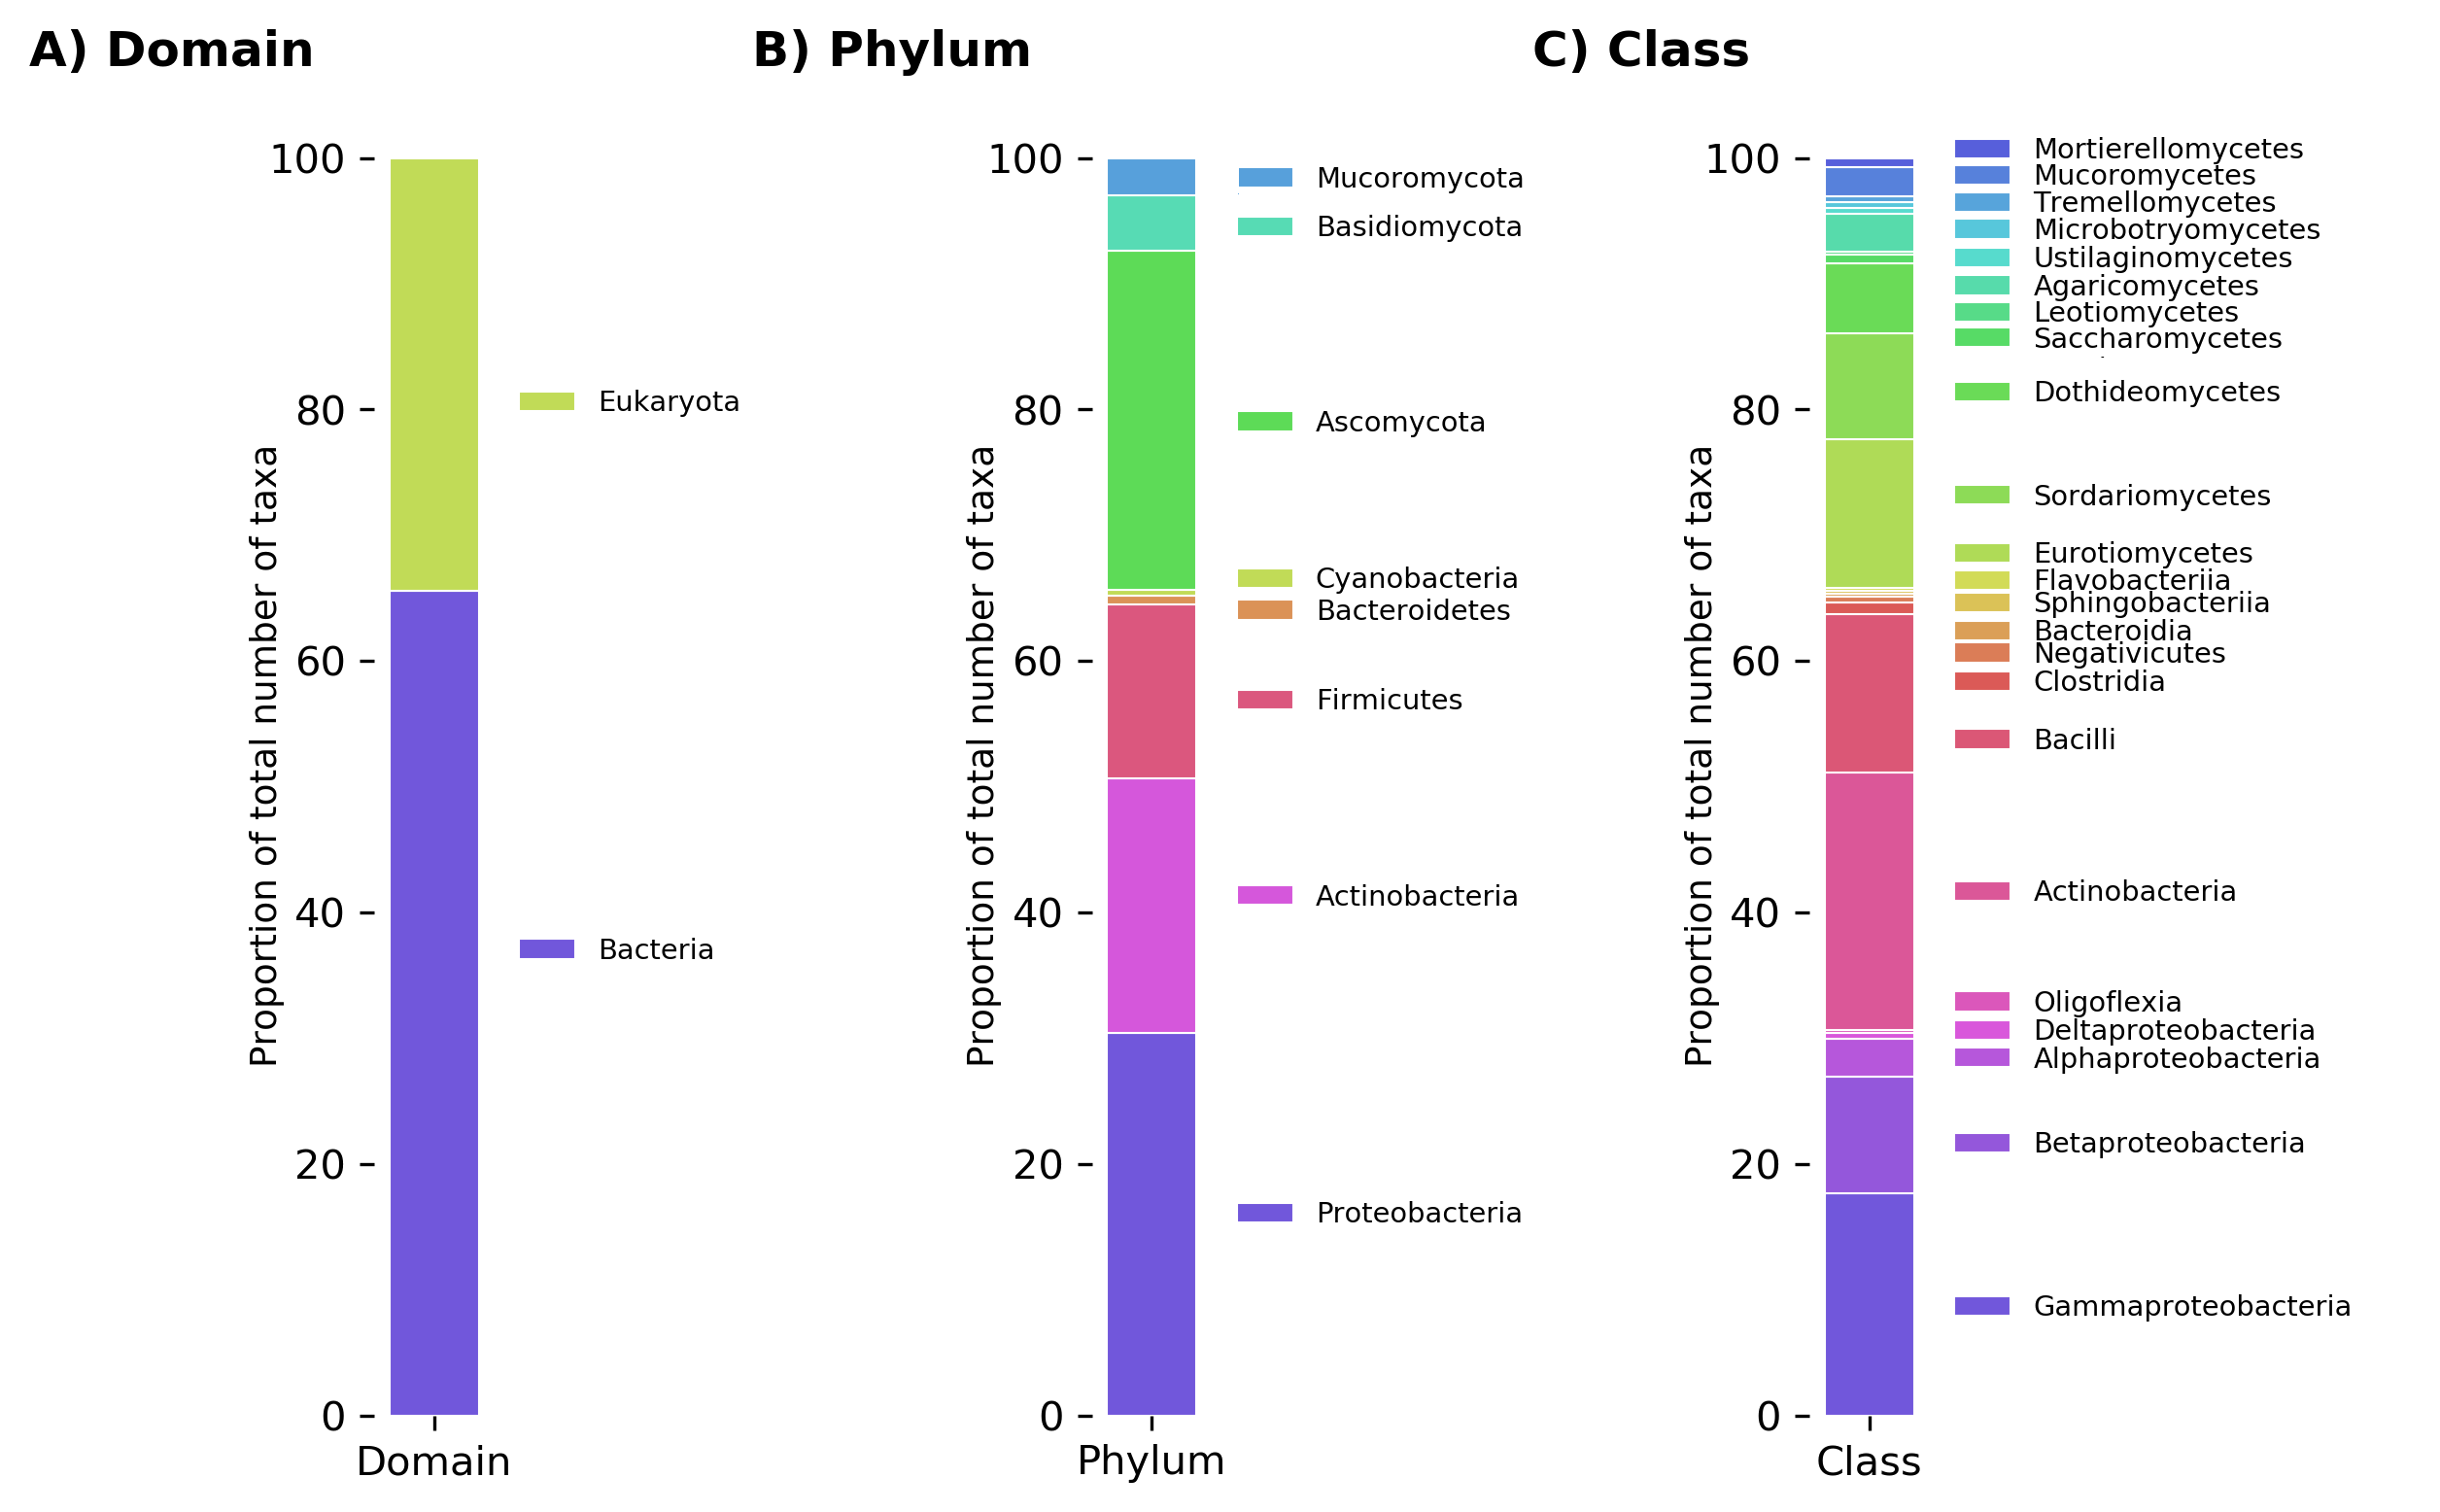
Relative abundance of all taxa reported to degrade plastics at the levels of A) domain, B) phylum, and C) class.
Relative abundance of all taxa reported to potentialy degrade plastics
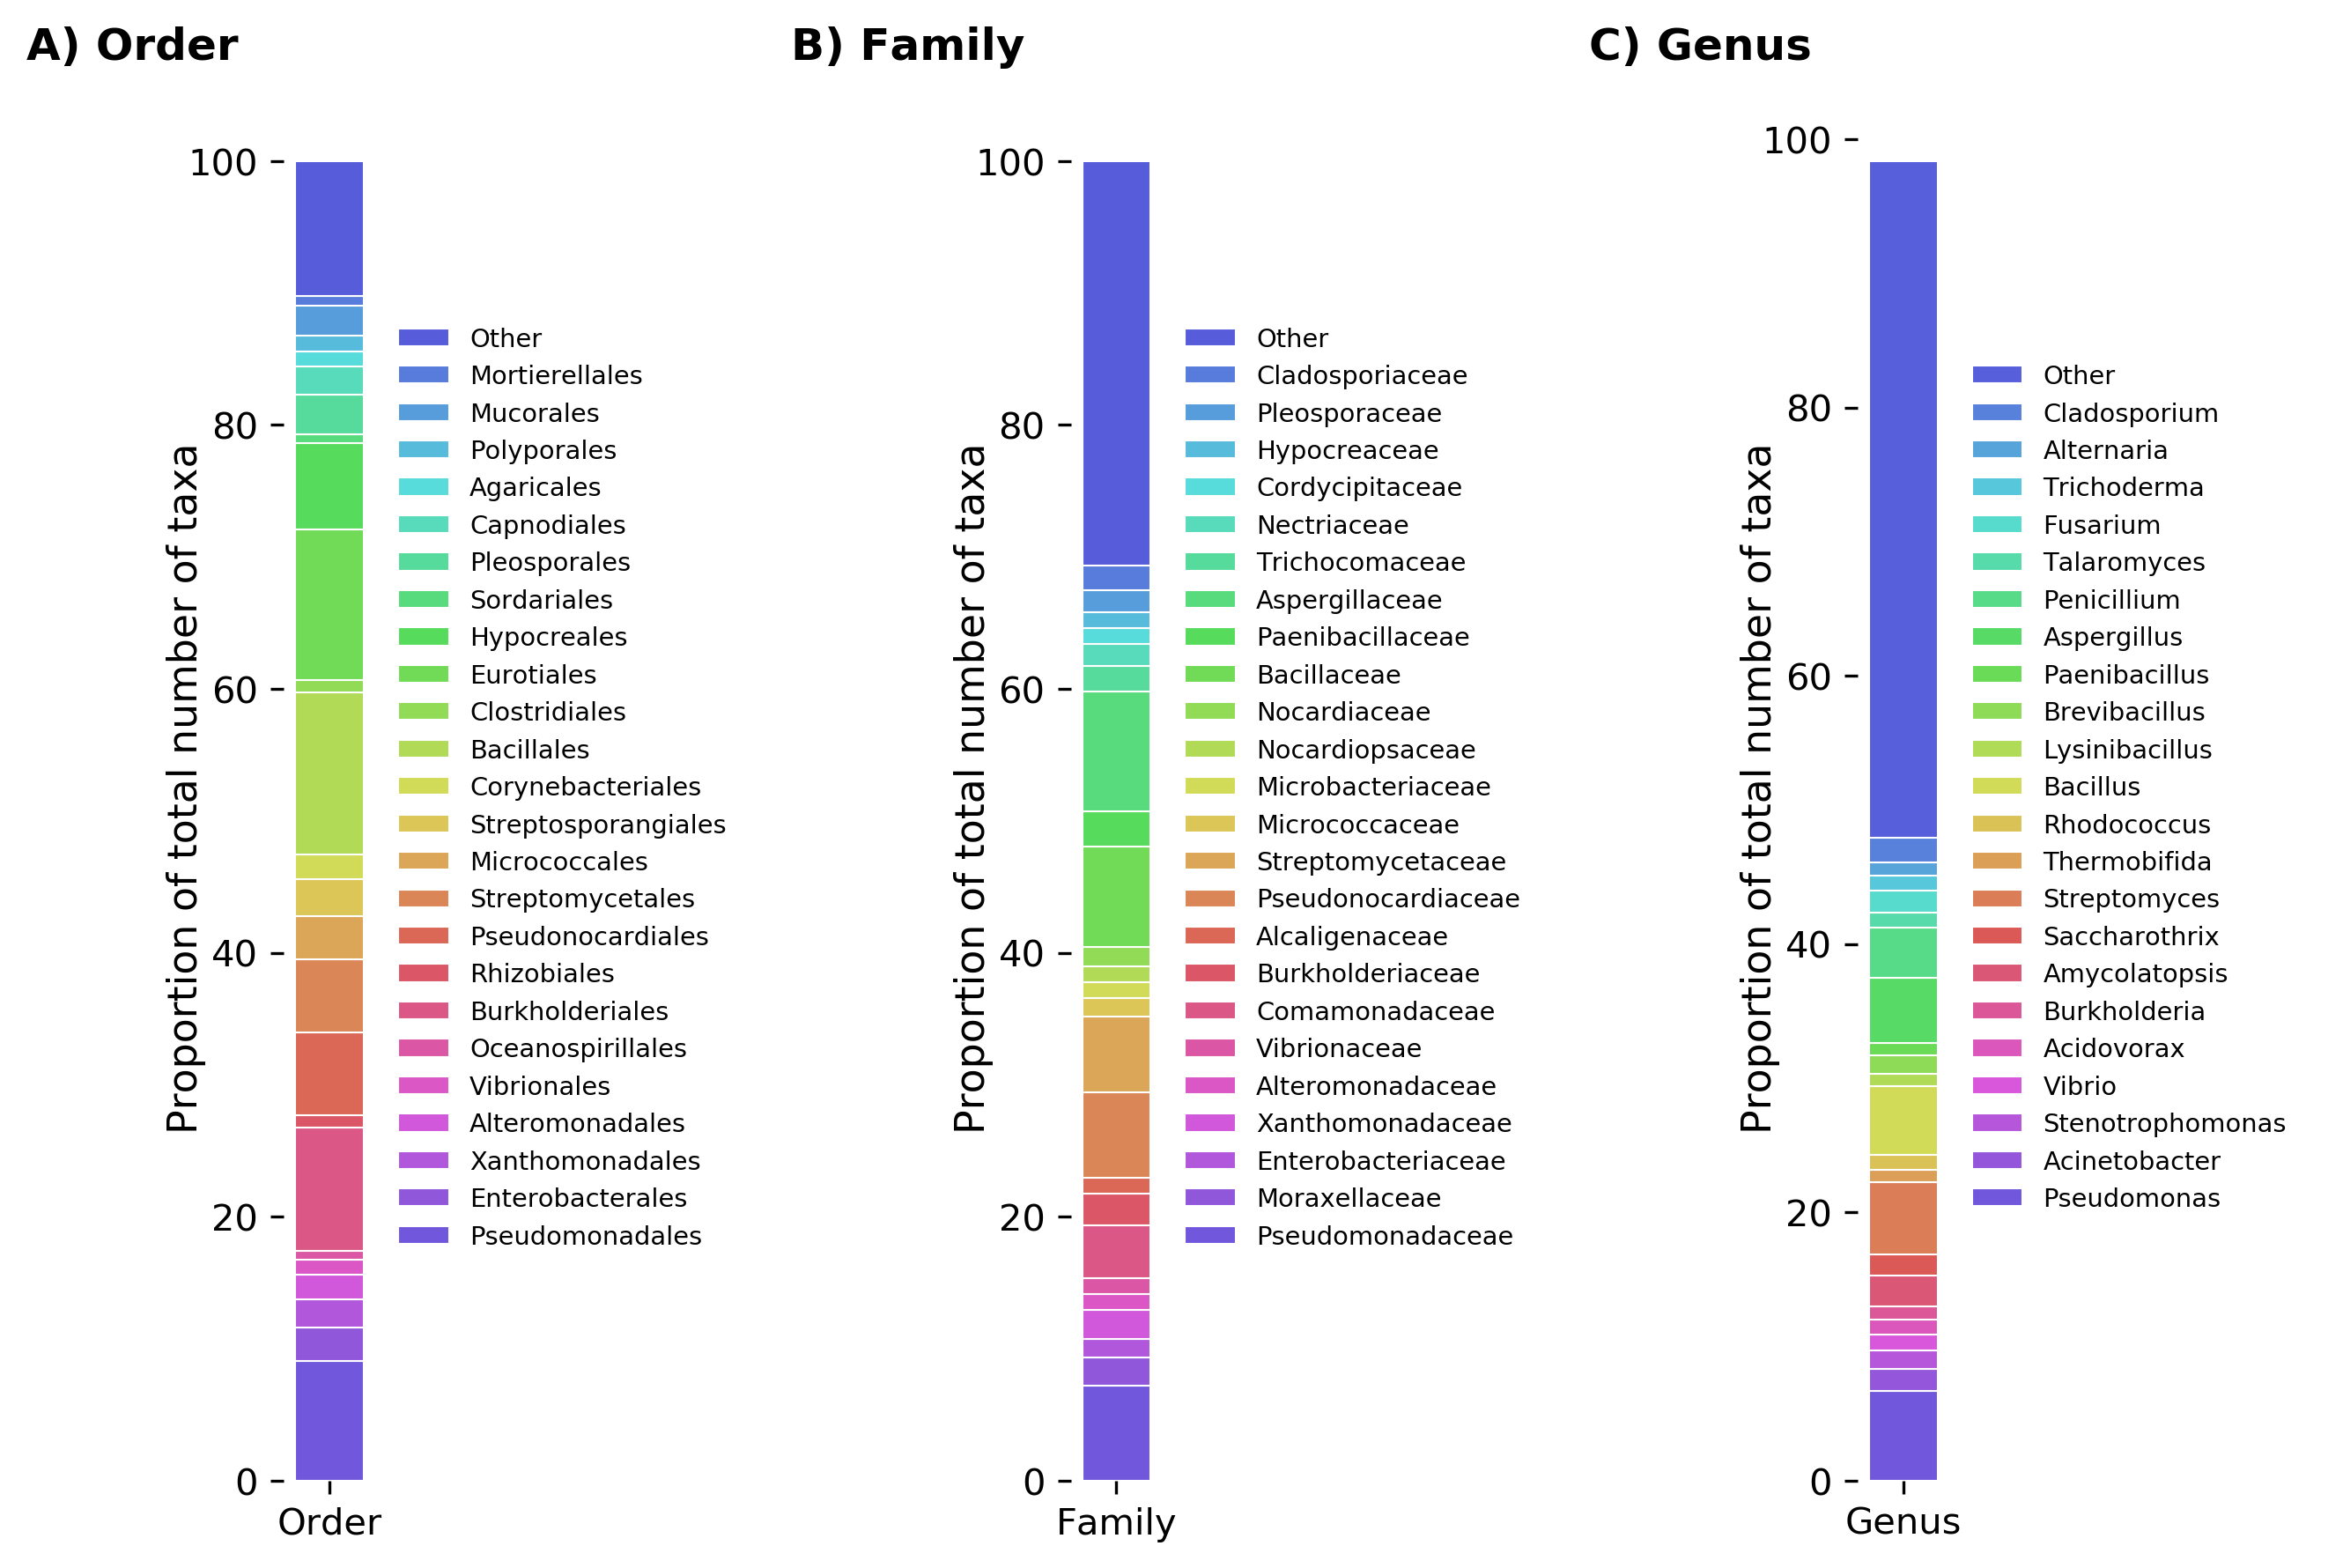
Relative abundance of all taxa reported to degrade plastics at the levels of A) order, B) family, and C) genus.
Techniques utilized to measure biodegradation in all publications compiled
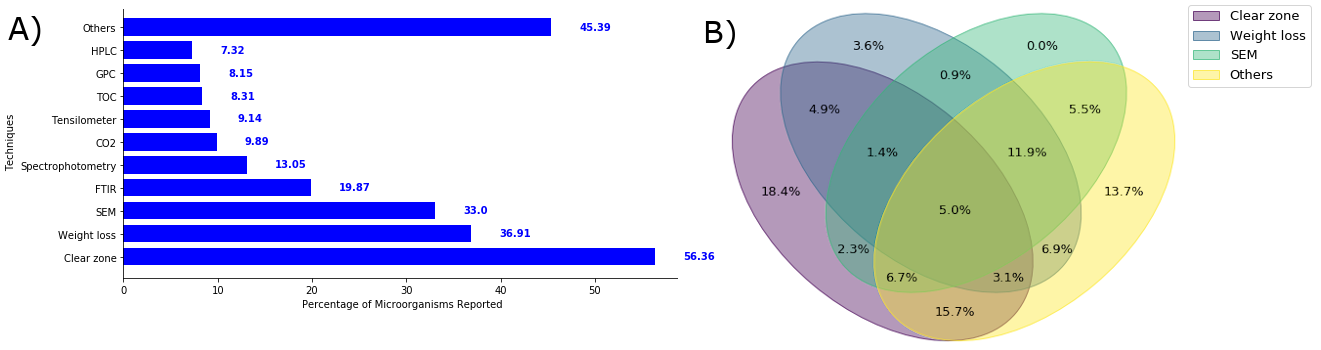
Techniques utilized to measure biodegradation in all publications compiled. A) Bar plot showing the percentage of the first ten most commonly used techniques. B) Venn diagram showing the overlap among the first three most commonly used techniques confirming that authors typically used more than one technique to assess biodegradation.
Phylogenetic tree showing abundances of genes similar to genes that encode plastic-degrading enzymes
Phylogenetic tree showing abundances of genes similar to genes that encode plastic-degrading enzymes that were identified in all microorganisms with reported plastic-degrading capabilities. Numbers over bars represent the number of BLAST (Basic Local Alignment Search Tool) hits within all available genomes of the respective phylum. An interactive version of this tree with all reported plastic-degrading genes is available at http://itol.embl.de/shared/gambarini with the code P5.
Number of orthologous genes identified as encoding for putative plastic degrading enzymes found in genomes deposited on NCBI
Number of orthologous genes identified as encoding for putative plastic degrading enzymes found in genomes deposited on NCBI for each type of plastic. The genes collated from the literature were used for sequence similarity searches using the BLAST algorithm with an e-value cutoff of 1e-10 and a similarity cutoff of 50%. Natural polymers are colored green and synthetic polymers are colored blue.